

Elections are decided by who shows up. Of course, I mean this literally: you have to show up to vote. But also, who shows up is not a fixed monolith from year to year. Midterm elections, lacking the opportunity to cast a vote for President, see reductions in voter turnout. Some people simply stay home when the top job is not on the ballot, and people who stay home are not chosen at random either. These “lower-propensity” voters who sit out midterms typically are younger and come from less-educated or lower-income backgrounds. Beneath that, is the fuzz of who actually shows up from within the “persuadable middle” part of the electorate. These people are perhaps persuadable in their choice of who they vote for (if you believe swing voters exist), but also persuadable in that you are required to convince them to show up to vote at all.
Broadly speaking, around thirty-three percent of Americans are irregular voters, who vote only sometimes, missing at least one of the last three national elections. Almost another third don’t vote period. Further, a whole eighty percent of Americans vote in neither party’s primary, and around forty-five percent are self-identified independents with no stated party loyalty, according to estimates from Pew and Gallup.
So, when you run an election in this country, you are technically only counting votes. But just below the surface, you are really counting millions of choices to vote in the first place, regardless of for whom the ballot is cast. Some large chunk of those votes will be cast by people who didn’t vote in the last election, and some votes will be absent from people who voted in the past, but sat out this year. Convincing them to vote, or your opponent’s failure to, is where elections are won and lost.
Which brings us to November 2026.
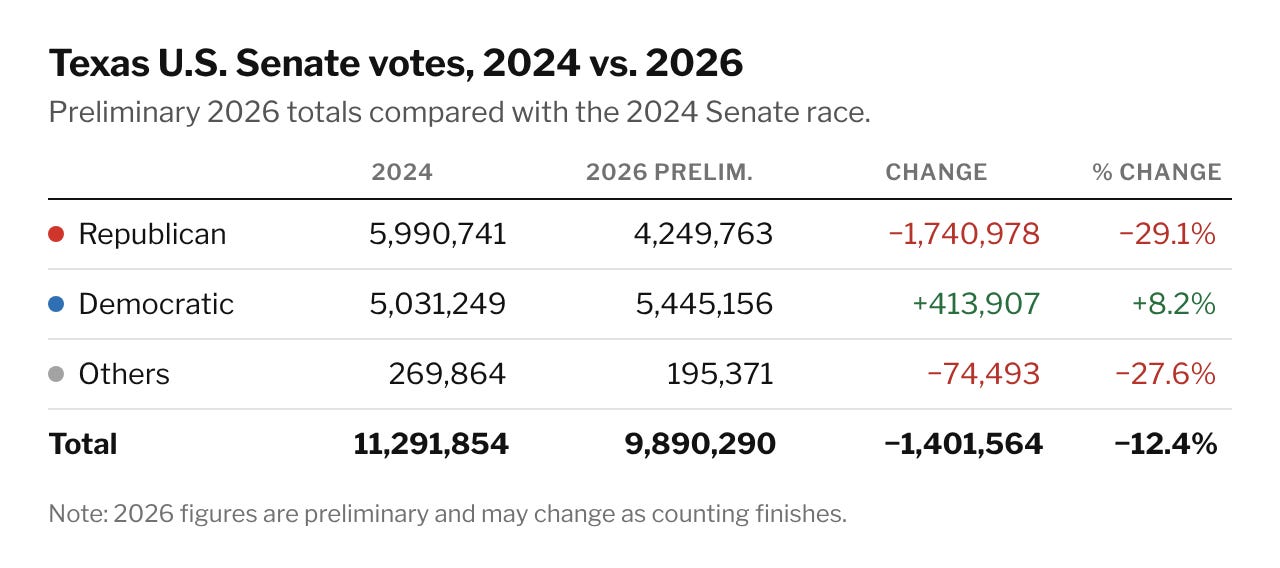
As I do not have to explain, a wave of candidates from the Democratic Party have been swept into office across the country, and especially in Texas. The table above shows how the top of the ticket looked in Texas, in the U.S. Senate race between James Talarico and Ken Paxton, and how it compares to the 2024 results between Ted Cruz and Collin Allred. As you can see, twelve percent fewer votes were cast, a customary midterm drop in turnout. Despite that drop in turnout however, James Talarico earned more votes than Colin Allred did two years ago. More people showed up in 2026 to vote for the Democrat than did two years ago, not just as a percent, but also as an absolute number.
So, the next obvious question is, “Where did those people come from?” And perhaps even, where were they two years ago?
Here we have exit poll data from CNN and their polling firm SSRS, where around 6,000 Texas voters were asked who they had voted for in 2024, and who they just voted for in the election between Talarico and Paxton. This is called a “recall” poll, and sometimes, people are unreliable narrators regarding who they voted for two years ago, or whether they voted at all. Specifically, their recollection can even be related to how they just voted, which introduces the error: correlation. Otherwise, their misremembering would sort of “net out” on both sides.
So, we have to take this with a bit of a grain of salt. We can’t point to individual people and say who voted for whom. However, when you parse out the data, you see some interesting trends that frame how the Blue Wave, or at least our own Texas version of it (I’m told we’re going with “Blexas”), should be understood.
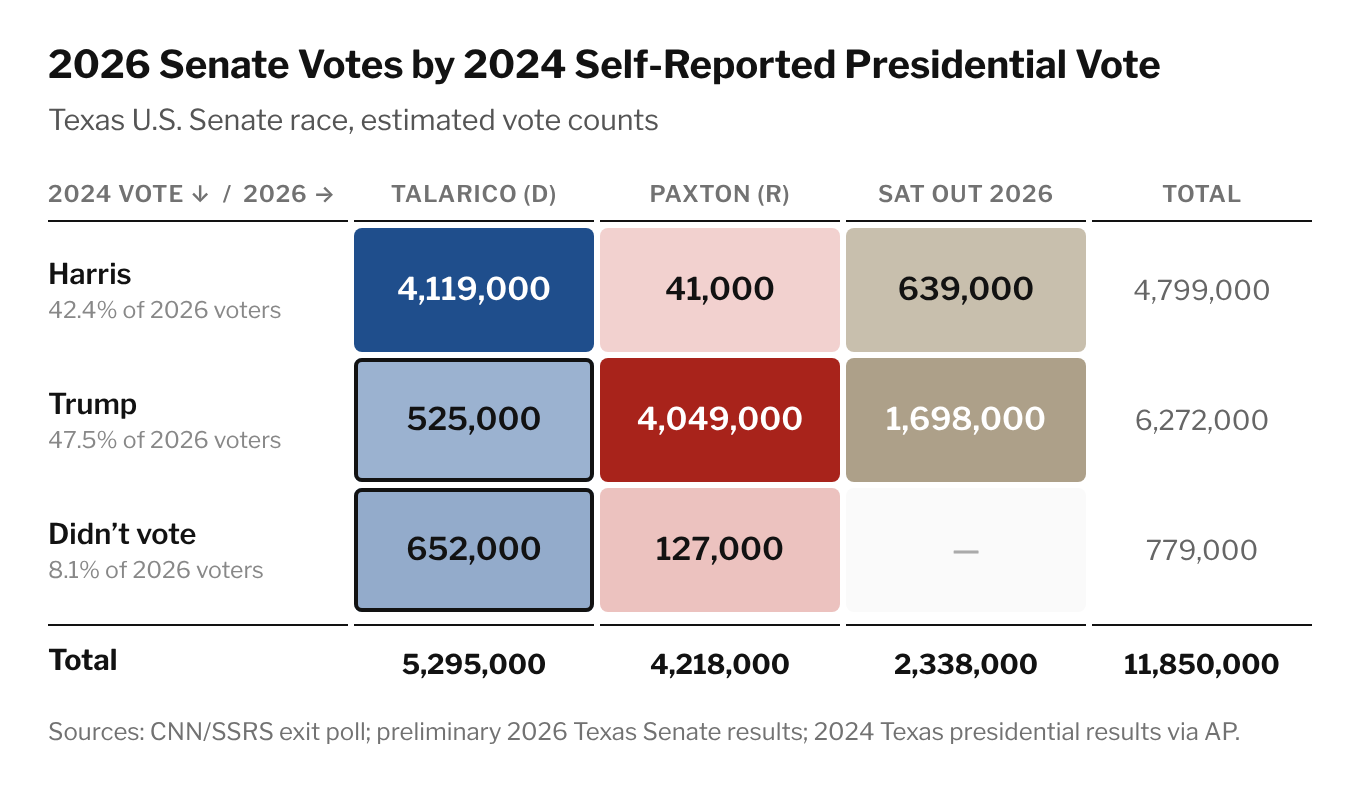
The chart above is my own creation, not scientific (I leave out people who voted for a third-party candidate, for example), and again, is based on “recall” polling. However, this kind of grid is the way it most makes the sense to me to think about all possible combinations of who people did or didn’t vote, and for what candidates, in the last two elections.
In 2024, Donald Trump won Texas by a little over 1.5 million votes. Last week, Talarico won Texas by about 1.2 million votes. That net change of roughly 2.75 million votes can be simplified into four pieces.
The biggest effect is the people who just stayed home. Those people were disproportionately Trump voters. About one million 2024 Trump voters, net of Harris voters who stayed home too, simply did not vote in this 2026 election. In total, something like 73% of the people who sat out 2026 had voted for Trump in the last election, much larger than the share of the general population who voted for him in Texas, which was 57%. Some of that skew could be chalked up to the demographics of Trump voters, a population that has increasingly come to include low-propensity voters. However, by my back of the envelope, the amount you would naturally expect that a midterm election in Texas should be “less Trump-y” would mean this percentage of people who stayed home would increase to at most about 61%, not all the way to 73%. The share of Texans not voting in 2026 who voted in 2024 is so overwhelmingly Trump-Republican, that propensity to vote alone cannot explain it. Some large portion of the “persuadable middle” came out for Trump in 2024, didn’t like what they saw the last two years and were no longer persuaded to vote, and this time just stayed home.1
The second piece is persuasion. Something like 525,000 people who wanted Donald Trump to be president in 2024, this time instead cast their vote for James Talarico, implying something like one in twelve Trump voters crossed party lines. This sum is over twelve-times larger than the 41,000 self-reported Harris voters that went the other way. Those two numbers net out to 484,000 people, but, the way we are looking at it, a vote-switcher counts twice. Each 2024-to-2026 party flipper takes a vote out of one column and also puts it into the other. This is another 970,000 votes moving from red to blue.
The third piece is the people who did not vote at all in 2024, but showed up this year. This is, in a sense, the inverse of people who stayed home. They made up about a whole eight percent of this electorate, and they broke for Talarico 652,000 to 127,000, a net of roughly 525,000 votes, with the Democrat earning 84% of this vote. CNN also asked if it was their first time voting in a midterm, 14% of the electorate was made up of people who said yes. Talarico won 75% of those voters. This goes back to what I called the “persuadable middle.” Of the people who looked at 2024 election and yawned, but this time were pissed off or enthused enough to vote, they overwhelmingly voted Democrat. I’ll get to why I think that is shortly.
Fourth and finally here, you have people who complicate the analysis by their having voting for third-party candidates in 2024 or 2026, such as Jill Stein in 2024, get caught in a rounding error, or said “I don’t know” to the pollsters. Collectively, this residual odds-and-ends bucket is associated with roughly an additional 200,000 more votes, breaking for Talarico.
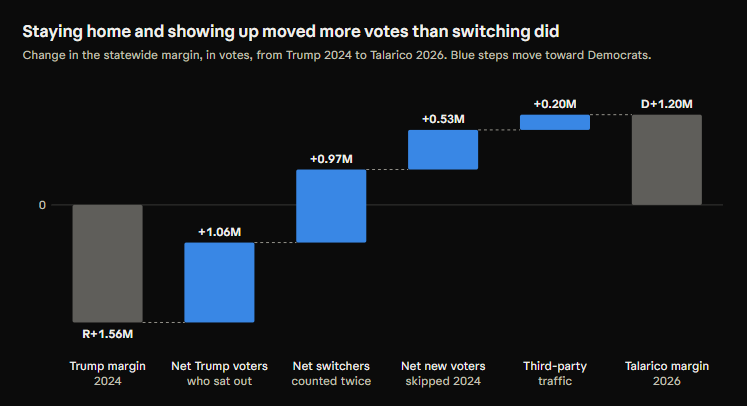
When you break each of these four effects out: you can walk from the 2024 presidential election to the 2026 results, and you see that no one single effect dominates the outcome. Trump voters sitting out, by itself, didn’t cause Blexas. And interestingly, persuasion and “voters pissed off enough in 2026 to vote but sat out 2024,” even combined, would not both have gotten you over the hump. You needed all three effects to see Talarico and the many Democrats below him on the ballot land in office.
The Wave
Again, elections are decided by who votes. Who votes is decided by what voters care about, and whether they care at all. What voters care about, and to what extent they care, changes every year, if not every day and minute.
So, let’s travel back to where Democrats, nationally, stood at the start of this election cycle. Blue Rose Research, a polling and data firm associated with Democratic campaigns, asked voters in early 2025 about their top issues and asked voters which political party they trusted more on each one. The three issues at the very top were cost of living, the economy, and inflation, and Democrats trailed Republicans on all three by somewhere between 10 and 20 points. The most important issue on which Democrats held any lead with voters at all was health care, which ranked fifth to voters, and that lead was only around two or three points, not something you could really build a campaign around. Artificial Intelligence was third-to-last, and in general, on eight of the top 10 issues, voters trusted Republicans more than Democrats.
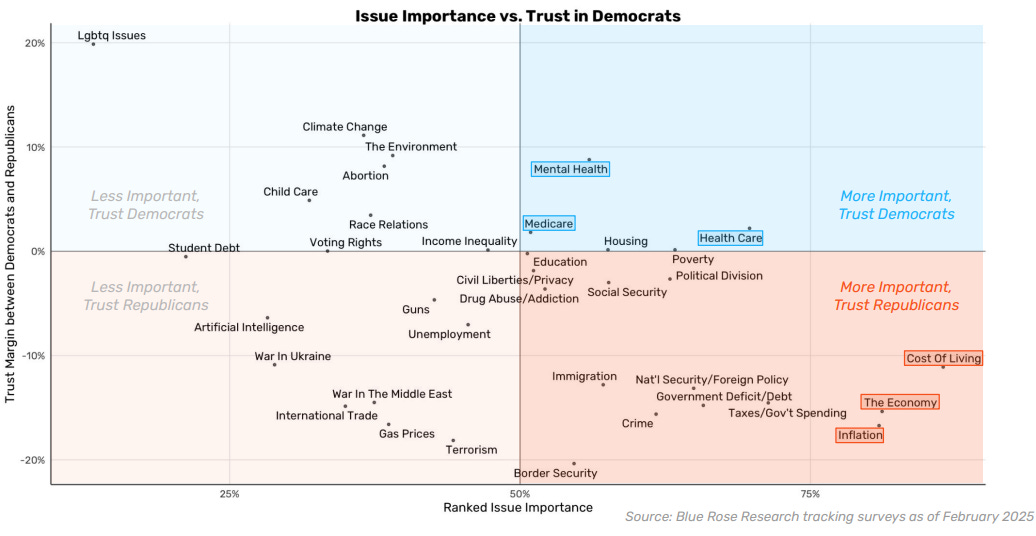
Oh boy. Doesn’t February 2025 feel like a really long time ago, looking at this chart? It’s hard to imagine a world where gas prices, War in the Middle East, or A.I. were in the bottom half of voters’ issues, or that “government corruption” didn’t even make the poll.
Twenty-one months later, the list looked different. In the 2026 election, the top five issues according to a CNN exit poll with around 80,000 respondents were: government corruption, cost of living, immigration enforcement, the Iran war, and AI & data centers. On the four topics you would guess, voters overwhelmingly thought the Democratic Party was offering them an answer they liked more than what Republicans had to say, and voted accordingly.
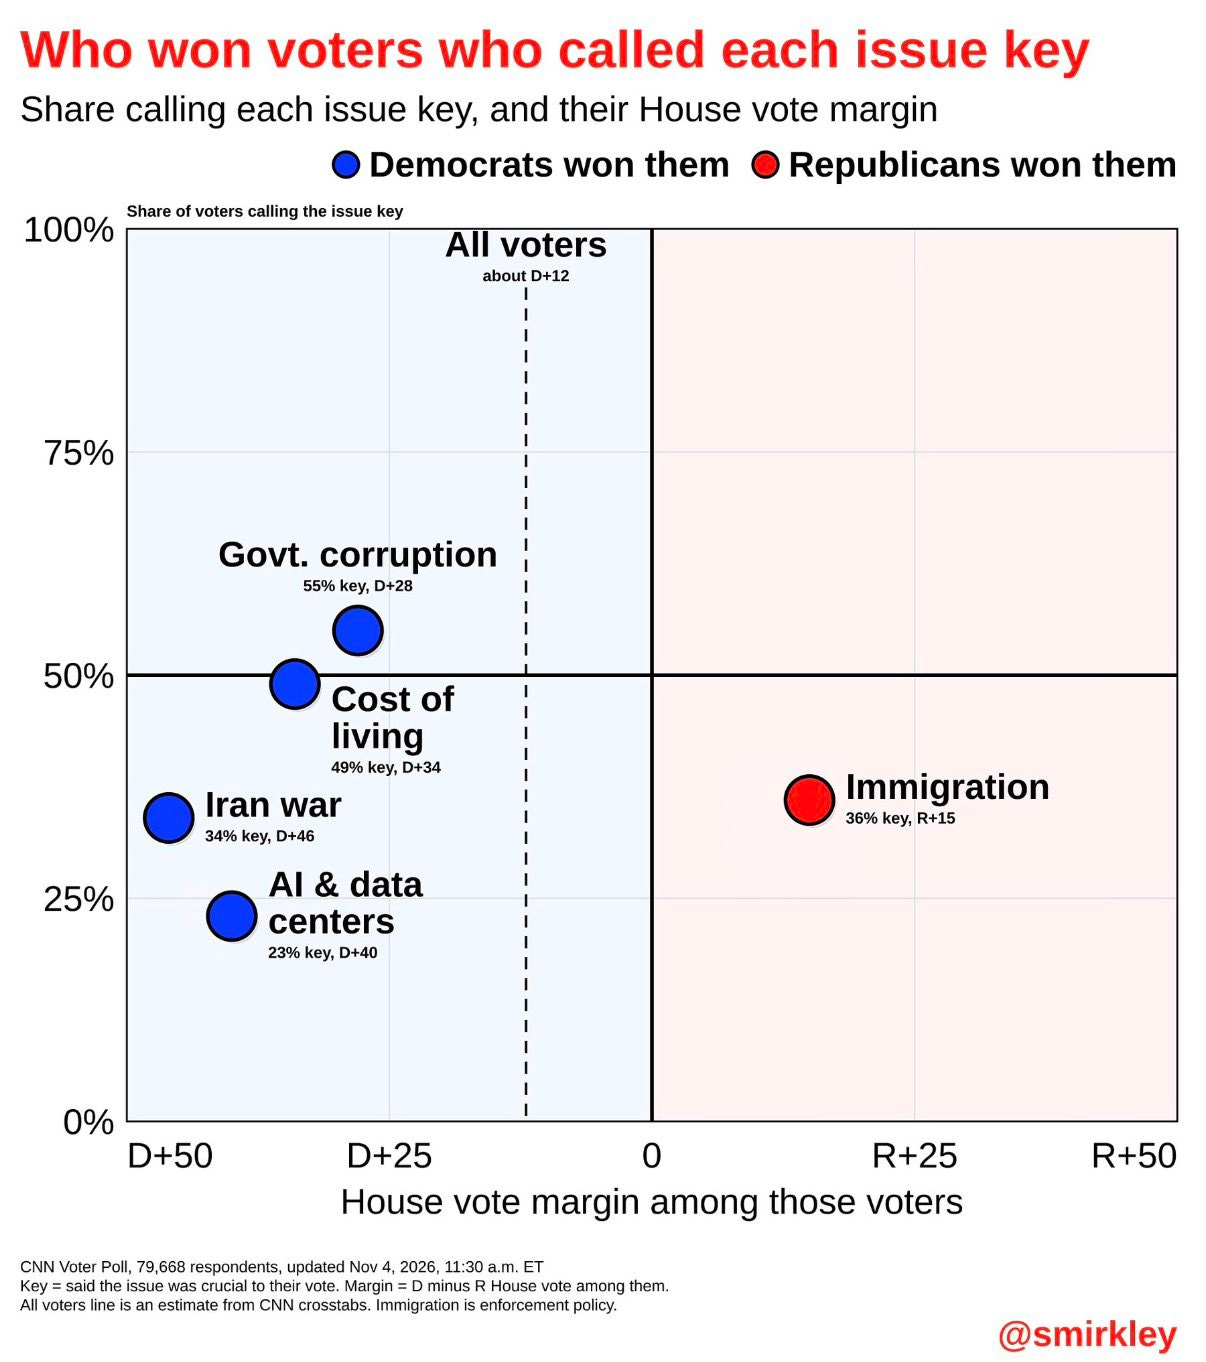
The only voters who were recorded as liking Republicans more were those for whom immigration was their key issue, and even among those voters, the split was only 57-43. This means a fairly large portion of voters to whom “immigration” is a key issue may be left-leaning voters selecting “immigration” in reference to ICE, deportations, and the Trump administration's crackdown on immigrants, as opposed to people who chose this as their top issue because they they are hardliners on immigration or the border, a distinction these labels can blur.
In only two years, both the issues that voters cared about (again, this is measuring the people who showed up, a non-random subset of the people) and the party they trusted to do something about them had both nearly completely changed. It’s hard to say the Trump administration left Democrats’ work cut out for them, with a fresh war in the Middle East and gas above four dollars. But it’s worth being specific about how large the move was. The cost of living was an issue that 55/45 favored Republicans last year, and this year broke 67/33 the other direction for Democrats.
I think elections work like this a lot more than we generally give them credit for. Voters can only have so many things that they care about, and your party can either have the compelling answer people like on that thing (and spend time talking about it), or not. It’s hard to convince voters to care about something that they don’t. It’s not impossible of course: how many voters actually have a data center being built in their backyard, compared to the number of people that say its a top issue? But still, voters will tell you what they care about. If you are not campaigning (and eventually governing) on their top issues, they are not going to come and vote for you.
And, again, most of the work is convincing people to vote at all, not just for whom. So, while the work is also “convince voters your party has the right plan for cost of living,” it’s also targeting that message to the forty percent of the country who vote infrequently, who I am calling “the persuadable middle,” though in reality, a large majority of these people actually self-identify with a liberal or conservative ideology.
It’s at the very least all circular. Convincing voters something is a compelling issue, like the case most notably U.S. Senator Jon Ossoff in Georgia has made against corruption, can certainly be a way to move voters to your side. But even watching the corruption message, Democrats repeatedly tied it back to “they’re getting rich, while you can’t afford gas,” and quoting Ossoff, “this corruption is why nothing works for ordinary people.”
Regardless, all of this combined to produce an electorate that entered voting booths very ready to try something other than what had been offered the last two years.
Texas was not the only place this happened, of course. Democrats flipped seven Republican Senate seats last Tuesday, in deep red states like Kansas and South Carolina. Still, measured from how far the Senate race moved from Donald Trump’s 2024 margin, Texas had the bluest wave in the country.
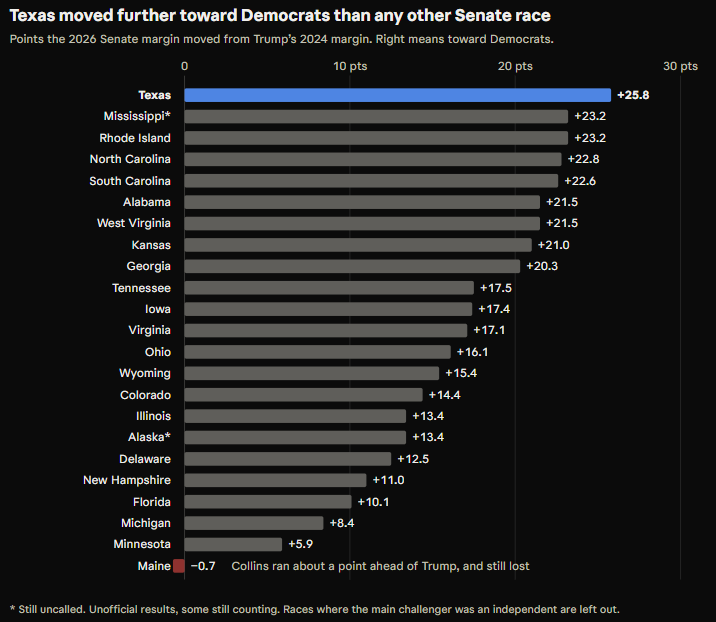
The base level shift away from Republicans nationwide is something like 17 to 20 points. Some of Texas’s outperformance, coming in at 25.8 points, needs to be attributed to candidate quality, on both sides of the ticket. On the other hand: some part of me thinks you could have replaced James Talarico’s name on the ballot with an “I Hate High Gas Prices” button and still seen Democrats sweep every statewide office.
To put a finer point on this, I think it’s instructive to look down-ballot from the U.S. Senate race that I’ve mostly focused on. Railroad Commission candidate and noted shithead Bo French generated perhaps the single largest negative story of the entire Texas election news-cycle, when he posted on Twitter that the University of Texas’s student section at a football game contained too many non-white students.
He did better than Ken Paxton!
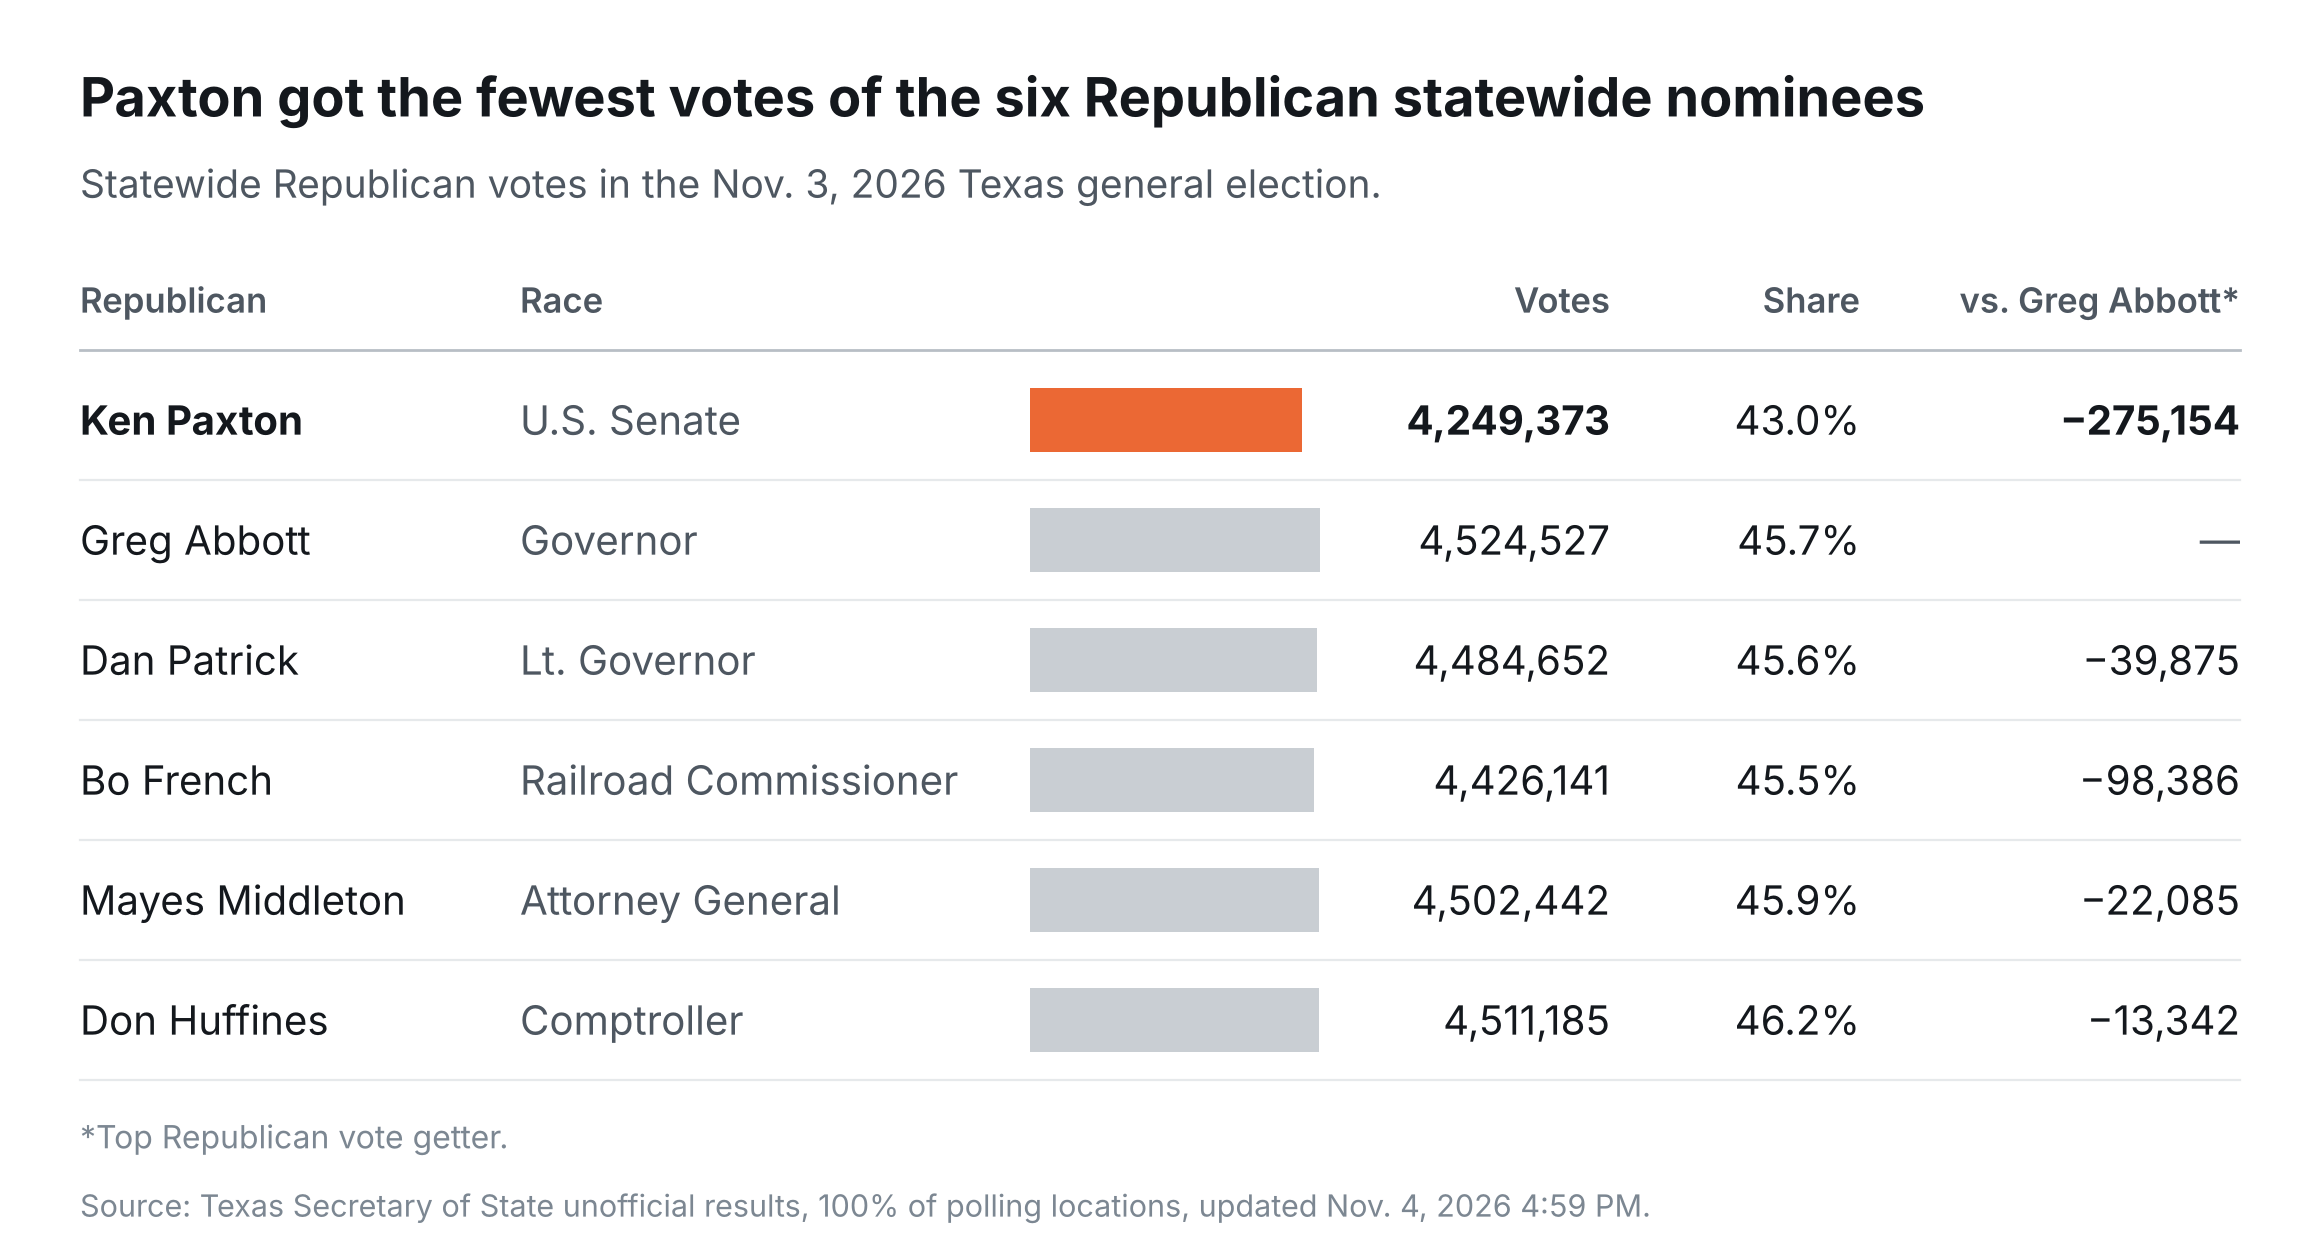
When you compare how Republicans did across these races, it’s hard to make a case that candidate quality mattered much at all, or that voters cared about anything but an R or a D next to the name. To the extent that in Tarrant County, a Democratic candidate who suspended her campaign in September when it came out she was a convicted felon sentenced to over five years in jail, still won her race and flipped a Texas House seat.
The people that showed up liked what Democrats were selling, it didn’t too much matter what you were running for.
The two Prop A’s
A few more local election quick hits before we get out of here. Both City of Dallas and Dallas County put ballot propositions in front of the voters to authorize new spending and/or debt. Both of them lost. In an election where a top issue was cost of living, this shouldn’t shock anyone.
And further, neither one was alone. Irving ISD asked voters for about $952 millio. Northside ISD, near Fort Worth, asked for $886 million, and Keller ISD for $828 million, and all three school districts lost. Across the state, we saw similar results at school districts in San Antonio, Cypress, and Georgetown. Texans for Fiscal Responsibility, a conservative think tank which was rooting for exactly this outcome, estimates voters rejected about 75 percent of the property tax-backed bonds and tax rate elections state wide on the November ballot.
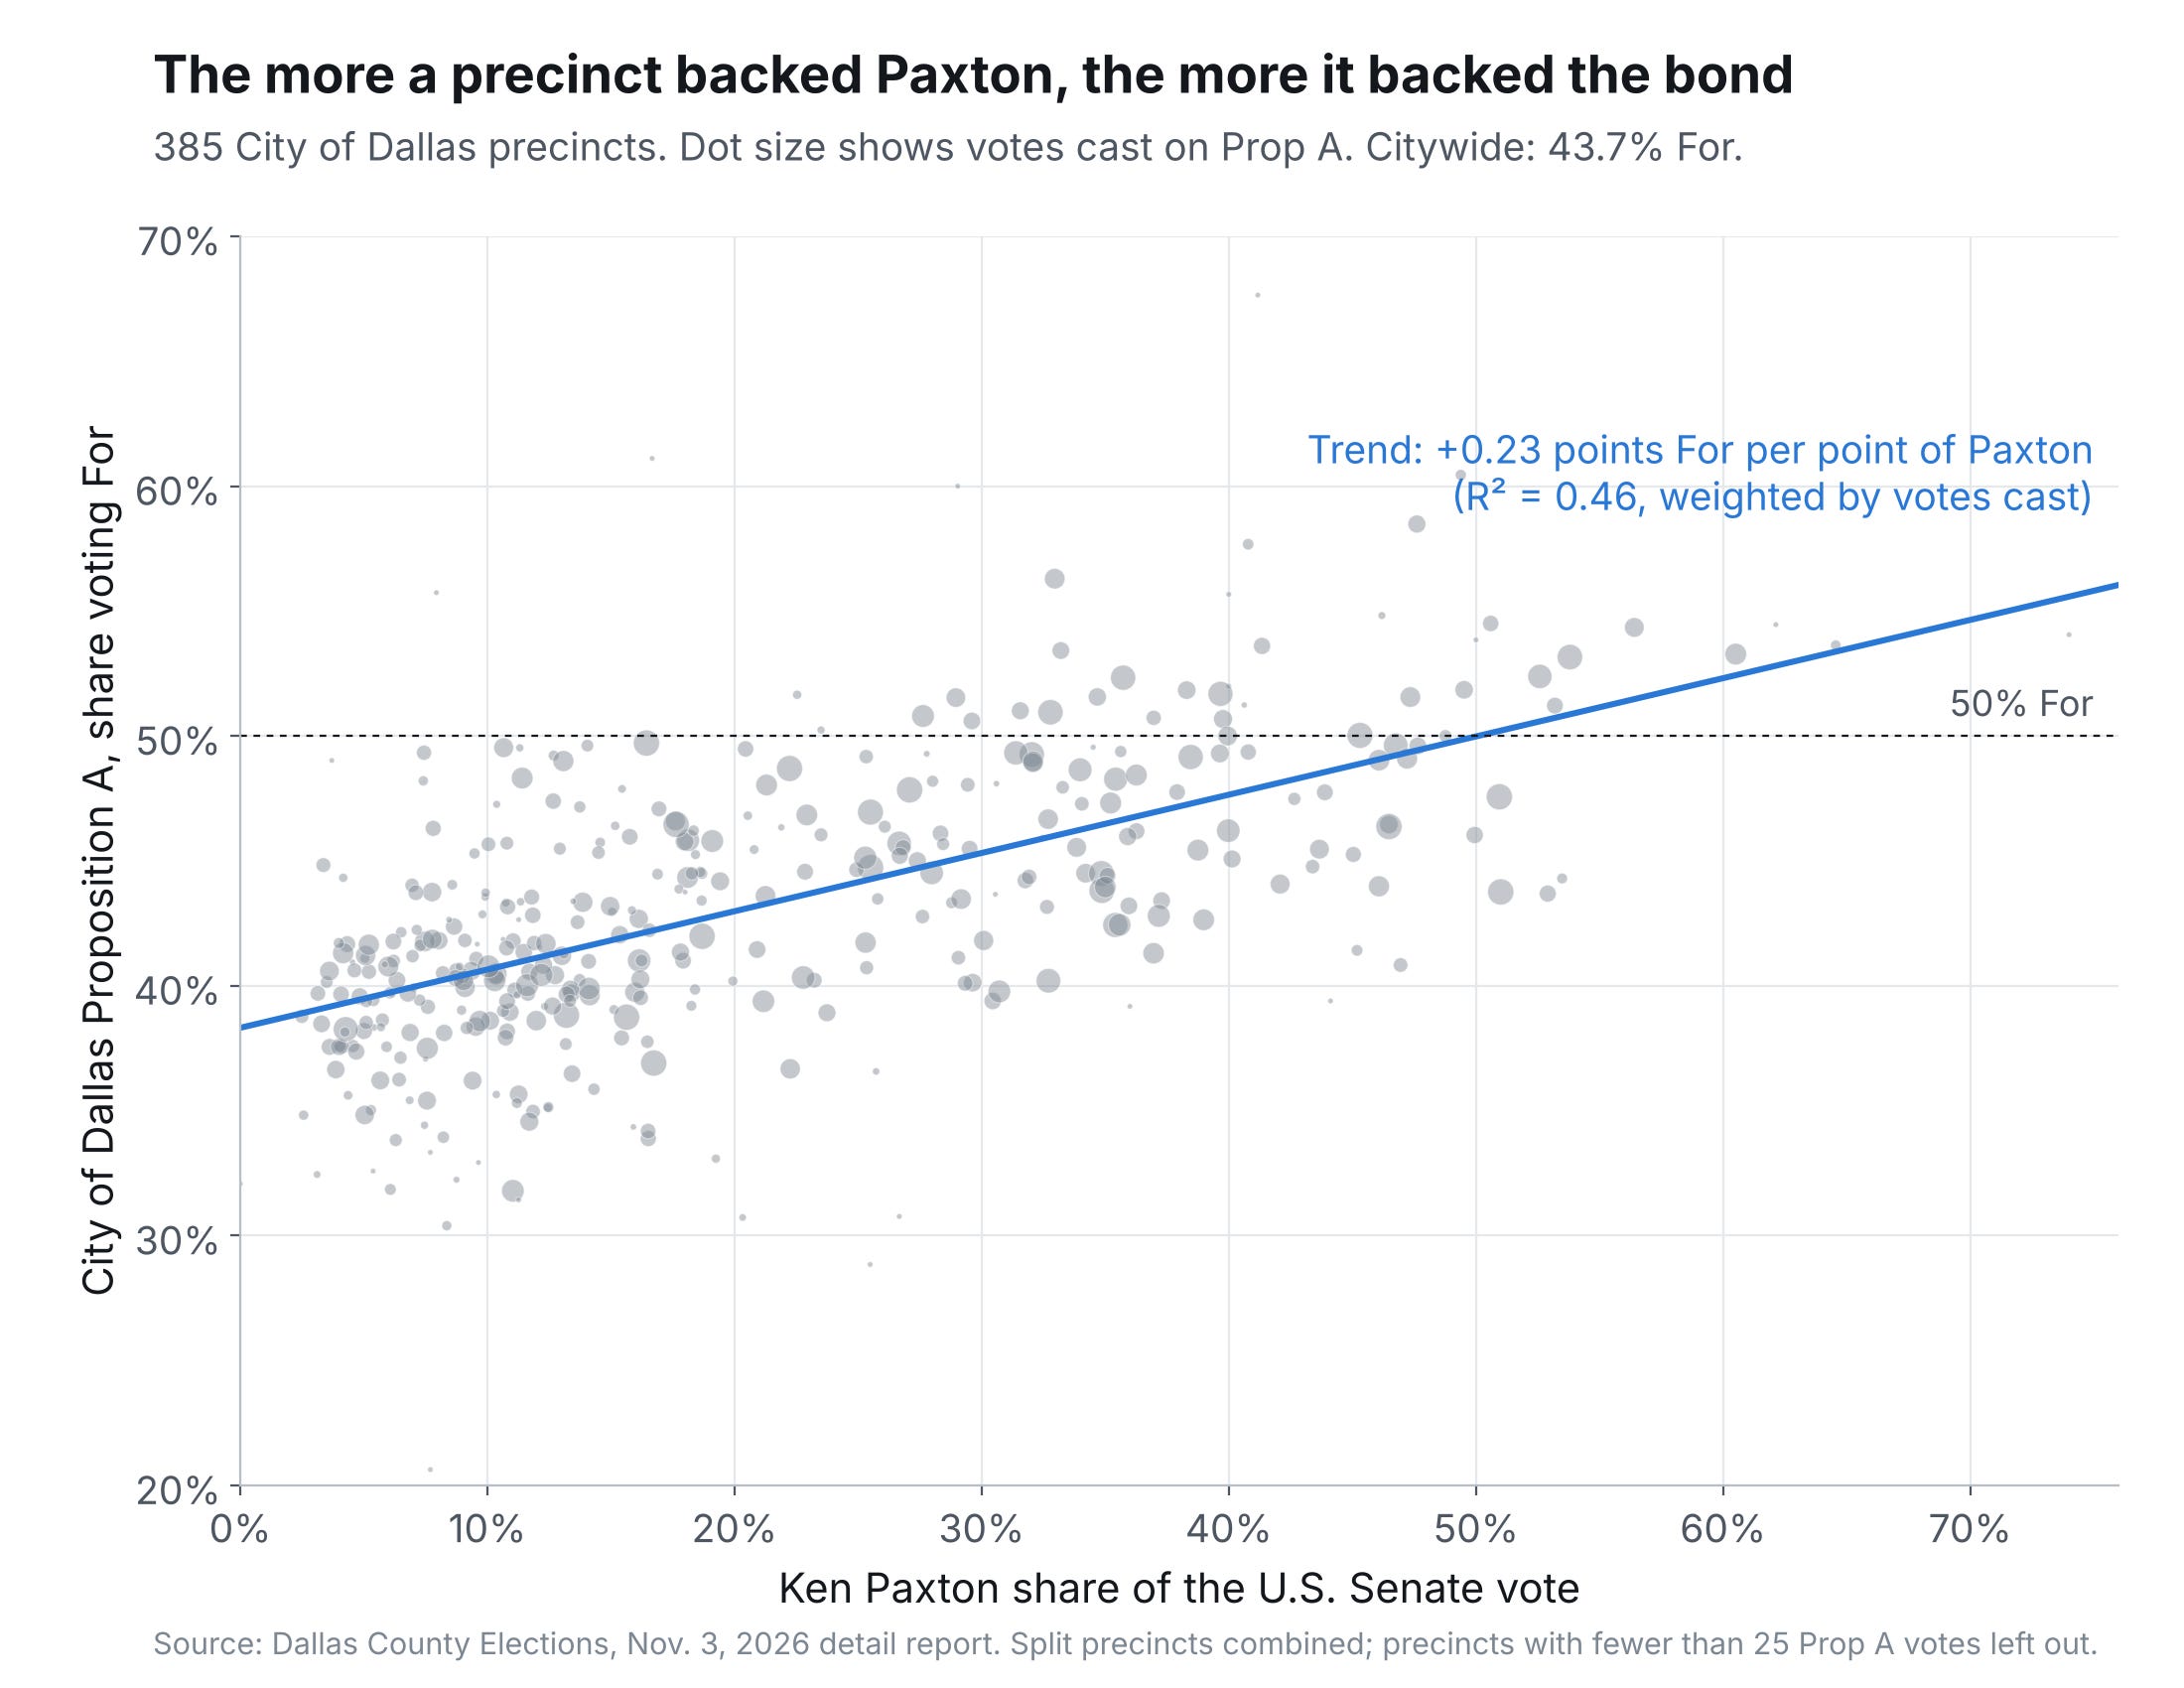
One chart on each. The City’s bond election, which featured “public safety” directly in the ballot language, coded fairly cleanly in the results as a left-right issue. Here, it was the Republicans who were in favor of higher taxes, as long as it went to cops. Further, an election that was less of a “wave” for Democratic turnout, may have actually still seen this proposition pass.
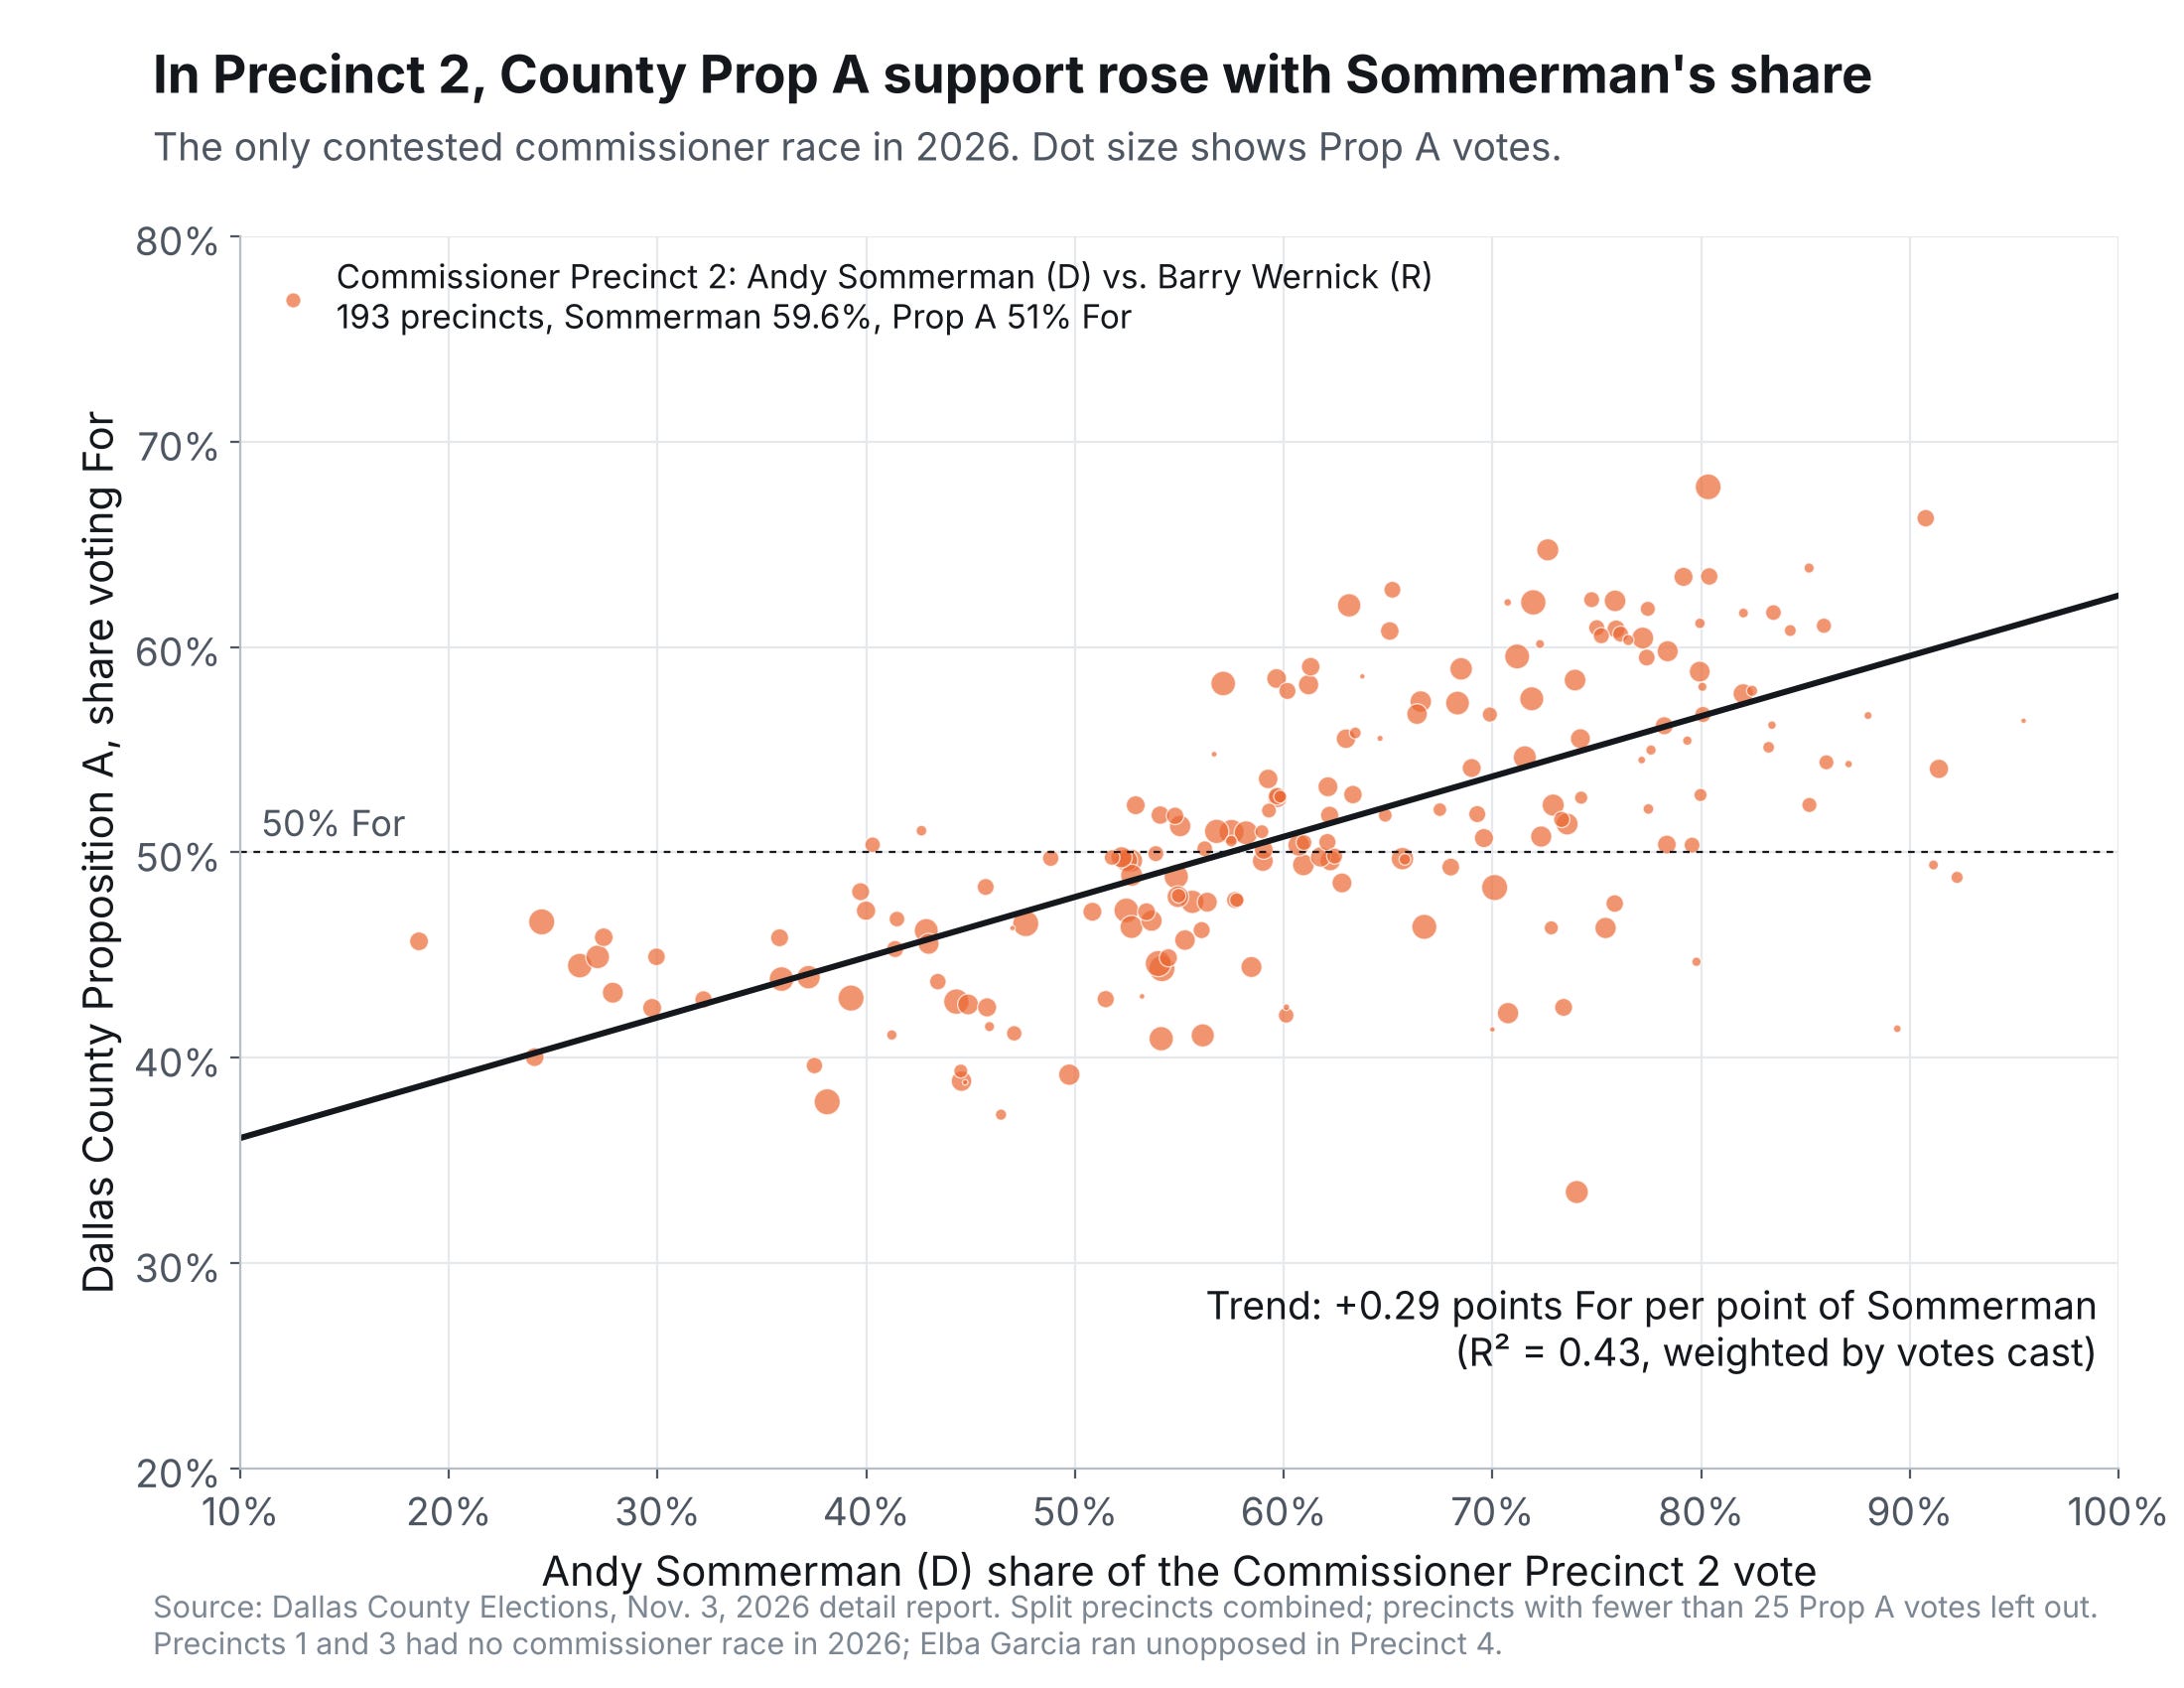
On the county, I lied, two charts. First is the vote share for Prop A in the lone county commission seat which drew a Republican opponent: Precinct 2 and the race between Andy Sommerman (D) and Berry Wernick (R). In these voting precincts, the vote on Prop A tracks the partisan lean fairly well, implying Democrats supported the measure. This makes sense: Wernick campaigned on the issue, and it was in part an idea advanced directly by Sommerman.
The other three county commission seats drew no Republican challenger. In three-quarters of the county, voters only had a contested race when it came to County Judge Clay Jenkins. Using that election as our barometer, interestingly, here the partisan lean of County Prop A starts to totally vanish. The underperformance that seems to have largely sunk the measure comes from the precincts of the two commissioners, Elba Garcia and John Wiley Price, who both voted against it when it came before the body, and both spoke out to voters against its passage.
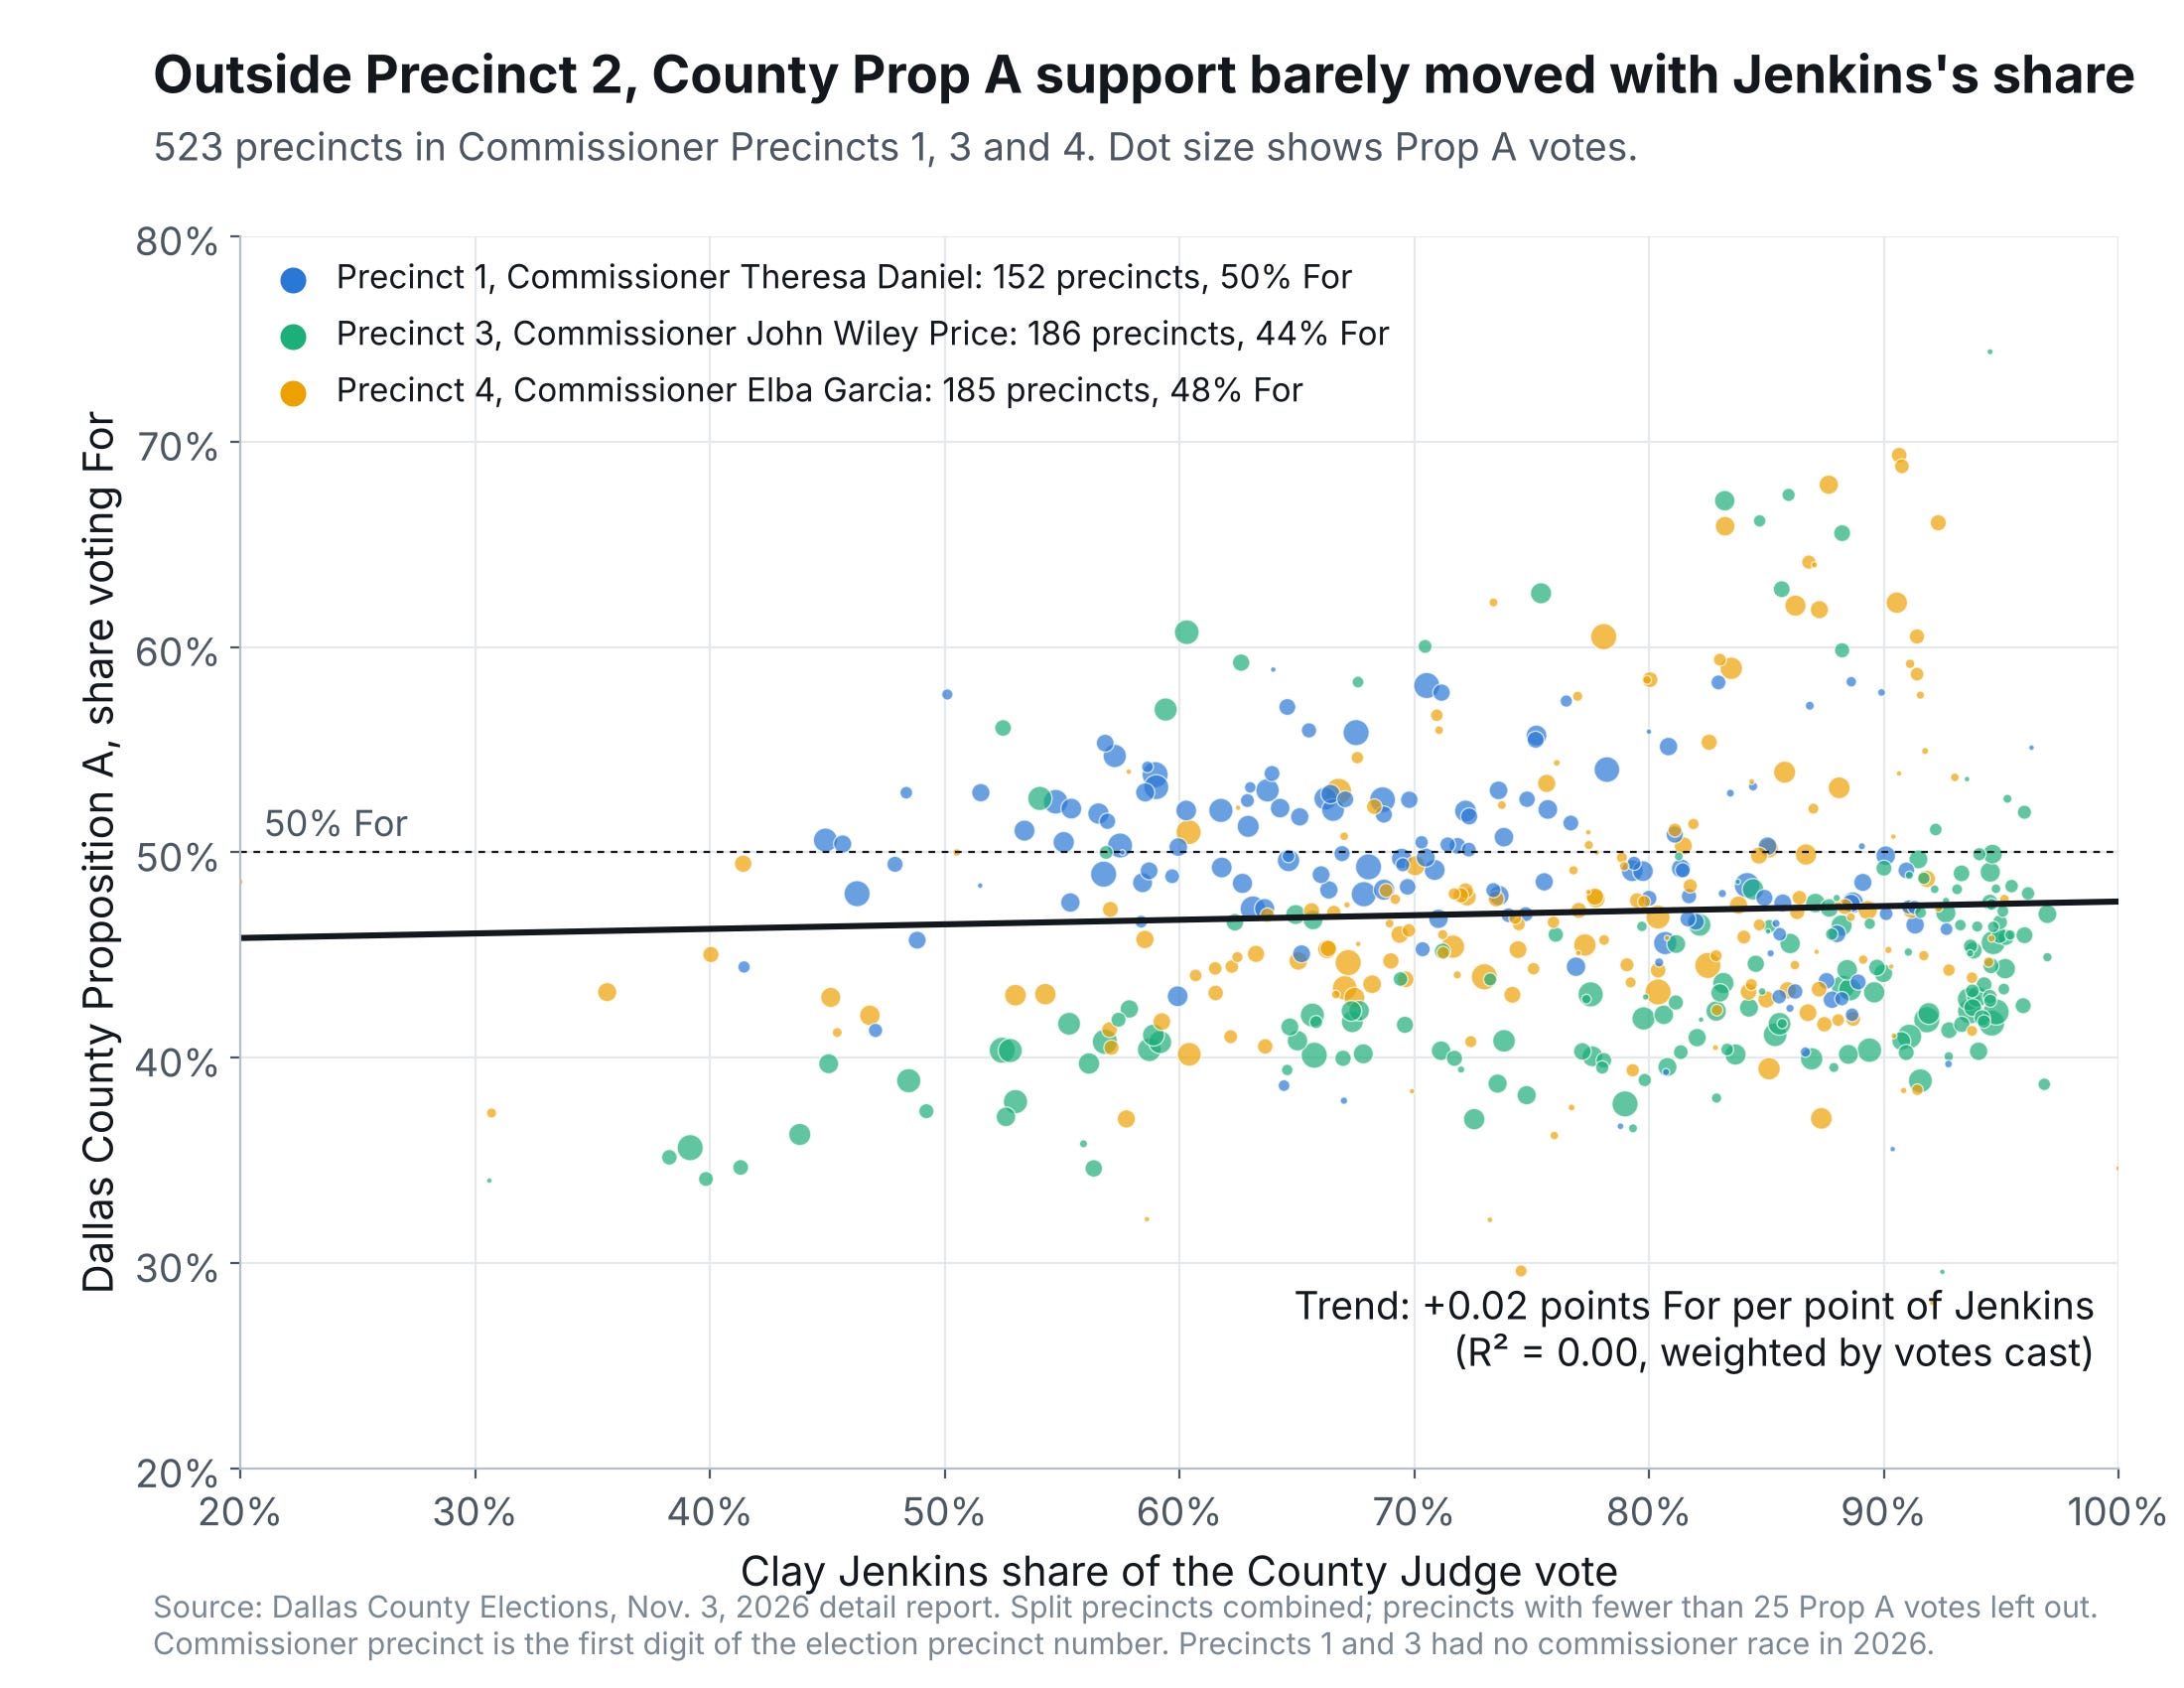
I point this out, how people that liked Republicans also like the City of Dallas Bond, but people who liked Democrats also liked the County Prop A (kind of, in part of the county) because it cuts against the affordability election narrative. If people came out to vote for the Democrats because they are so fed up with the high cost of living, then it’s not obvious to me why those people also voted to raise their own taxes. Granted, that doesn’t hold in all parts of the county. You could convince me that this may have split along income lines, and looking at a map of where it did better and are more Democratic, I could be convinced that this vote is a weird 3D artifact both of income and of partisan lean. I don’t entirely know what to do with this, but I’m just pointing it out.
What’s the Plan, Plano?
Plano had a Prop A of its own. Voters rejected it by about 55 to 45, which took five proposed new venue-related taxes off the table, all of them meant to help cover the city’s $700 million share of debt on a $1 billion arena for the Dallas Stars at the Willow Bend Mall. After the defeat, a statement from Plano’s city manager read: “Without authorization for these venue taxes, the proposed financing approach would need to be reassessed before City Council considers any actions related to the arena.”
The Stars already have one alternative in mind. The team says it will keep working with the city “as it pursues a project finance zone to be created by the Texas legislature.” If that sounds familiar, it is. A project financing zone (PFZ) is how Dallas and Fort Worth, Houston, and San Antonio are all planning to pay for our new convention centers.
To form a PFZ, a city draws a three-mile circle around a qualified venue project, and for the next thirty years, the increment or increase in hotel occupancy, sales, and mixed beverage taxes that would otherwise go to the State, goes back to the city and the PFZ instead. Hotel tax in Dallas, for example, is fifteen percent, but we normally only keep nine percent, the rest going to Austin. Inside our PFZ around the convention center, the state’s six percent, or at least the part that grows after the zone is drawn, stays here to repay the debt used to build the building.
It’s not a terrible idea, and its arguably a better deal for Plano taxpayers than many of the alternatives. This would essentially let the State of Texas pay for (part of) the new arena.
Plano is not one of the cities state law lets form a PFZ: the list currently is Dallas, Fort Worth, Houston, Austin, San Antonio, Lubbock, and Corpus Christi, which is why the Stars & Plano need the Legislature’s help to create one. I would actually guess this has always been the plan, but putting the taxes in front of voters first shows good faith that they didn’t come to the Lege without first trying to pay for it themselves.
What Next?
Well, that’s a heck of a lot to write about something that already happened a whole week ago. Let’s end back where we started. These elections were decided by people who showed up, the people who were persuaded enough to show up. They were persuaded in two at least directions at once.
On one side were the marginal Trump voters, the ones who showed up for him in 2024 and did not for Paxton or Abbott. About 1.7 million of them just stayed home. On the other side were marginal Democratic voters who so disliked what Republicans had to say that they voted D all the way down the ballot. Democrats even won all four open seats on the Texas Supreme Court that were up this year, including chief justice, plus every other statewide race on the ballot. Those are races most normal people likely decide on party label alone, and this year the better label to have was “D.”
On four of the five key issues that mattered most to the people who decided to vote, Republicans did not have the answer those voters wanted. That was not true two years ago. The people who decided to vote this year are not the people who will show up next time. In 2028, Trump’s name will not be on the ballot (God willing), but a presidential race will be. Some share of those 1.7 million voters will come back.
Which means the work is two-fold. You have to have the right answer, and you also have to convince voters that the issue most important to them is the one you are best on. Change the issues and you change who shows up; the math changes with it.
This may be a more fragile majority than the results suggest. It was built on mainly those who stayed home, as much as it was built on who changed their minds.
The people who stayed home get a vote again in two years.
love/hate/other to Kirk P. at: onemansdallas@gmail.com
You can also think of this in the inverse as “vote persistence”. Talarico was able to bring out 85% of Kamala voters to cast a ballot for him. Paxton was only able to draw or retain 65% of Trump voters. These are the voters you start every cycle with, and you will keep most of them, so it’s probably fair to talk about “who votes” as much as “who doesn’t”, but I’m focusing on one formulation of the same image here more than its inverse.
I do enjoy your writing, but take exception to one small issue. I may be in a minority, but, having failed spectacularly at UT Austin, I have no formal education beyond high school. I don't count the courses that the City of Dallas sent me to as a fledgling network tech: Memotec X.25 PAD, IBM Bisync/EBCDIC, SNA/SDLC. Those were just things I needed to know to function in the workplace. The later CISCO courses were more of the same.
I follow politics due to being exposed to Molly Ivins and Hunter S. Thompson. The two of them were more formative to my political worldview than any lackwit writing for NYT or WAPO.
As Molly said, long ago, "It is Texas Legislature season in Texas again, and many a village is missing its halfwit."
Hunter, of course, wrote the most vicious obituary of a politician on Richard Nixon, and that "man who had to have helpers screw on his pants, he was so crooked" remains my guiding light on how to think of Perry, Abbot, and Paxton. We'll leave Shrub alone, he's welcome to stay up in Preston Hollow and draw pictures that would make Hitler blush with their amateur qualities.